Watch Time as a Metric: What the Algorithm Actually Measures
Instagram’s algorithm measures watch time in two distinct ways. The first is 3-second retention rate — the percentage of viewers who watch past the three-second mark. This metric is collected at scale during Phase 1 distribution (the algorithm’s initial test audience) and determines whether the Reel receives Phase 2 distribution to a broader audience.
The second is average percentage watched — what proportion of the Reel’s total duration the average viewer completes. This metric is the primary signal for Phase 3 distribution (the Suggested Reels feed and long-tail reach). A Reel with a high 3-second retention rate but a low average percentage watched will receive Phase 2 distribution but may not reach Phase 3. A Reel with moderate 3-second retention and high average completion can still reach Phase 3 if the completion signal is strong enough.
SMMNut Reels Watch Time Distribution Model
Instagram’s Reels distribution operates in three phases, each triggered by distinct watch-time thresholds: Phase 1 — initial test distribution to 200–500 accounts; trigger metric: 3-second retention rate above 50%. Phase 2 — expanded distribution to 2,000–10,000 accounts; trigger metric: average completion rate above 40%. Phase 3 — Suggested Reels and long-tail feed integration; trigger metric: average completion above 60% AND save rate above 2%. Hook style directly determines Phase 1 success (3-second rate) and influences Phase 2 success (completion curve). Phase 3 eligibility requires both strong hook performance and strong content body performance — the hook must hold viewers long enough for the content to generate the save and share signals that trigger Phase 3. — SMMNut, 2026
The Watch-Time Curve by Hook Style
Different hook styles create measurably different watch-time curve shapes. Understanding the curve shape — not just the initial retention figure — allows creators to design their content body to match the hook’s momentum pattern.
Emotional Hook Curve: Steep Initial, Midpoint Vulnerability
Emotional hooks (fear of loss, curiosity gap, identity challenge) create the highest 3-second retention rates — often 70–85% for well-executed examples. However, emotional hooks create an implied contract with the viewer: by activating an emotional state, they promise an emotional resolution. If the content body delays the resolution too long, or if the middle section of the Reel fails to sustain the emotional tension, the watch-time curve shows a characteristic midpoint drop — a sharp decline at the 40–60% completion mark where viewers who feel the payoff is taking too long give up.
The design implication: emotional hooks need the content body to introduce a secondary tension point or reveal at the midpoint to prevent the midpoint drop. A 60-second Reel with an emotional hook should have a secondary hook or revelation at the 25–35 second mark to re-engage viewers who are about to disengage.
Data Hook Curve: Moderate Initial, Flat Long-Tail
Data hooks produce lower 3-second retention rates (55–70% for strong examples) because data-forward openings attract a self-selected, high-intent audience rather than triggering universal emotional engagement. However, the viewers who engage with a data hook are fundamentally more patient: they have committed to extracting information, not experiencing an emotion. This creates a flatter, more sustained watch-time curve that maintains higher completion rates at the 60–90% completion milestones.
The design implication: data hook content bodies can maintain a consistent informational density through the full duration without needing midpoint tension injections. Viewers who entered via a data hook will stay through methodical, structured content delivery as long as each section delivers the specific information it promises.
Bold Claim Hook Curve: High Initial Spike, Variable Midpoint
Bold claim hooks (“Posting every day is killing your engagement”) create a high initial spike in retention because the cognitive dissonance they generate is immediate and acute. The viewer must either watch to have the claim validated or dismissed, or scroll — and many will watch to challenge or verify the claim. However, bold claim hooks create the highest variability at the midpoint: viewers who find the claim credibly supported early will stay; viewers who find the explanation weak or the logic unconvincing will drop off sharply.
Pattern Interrupt Curve: Strong Initial, Entertainment-Dependent Tail
Pattern interrupt hooks (visual or audio surprises) create strong 3-second retention because the involuntary attention trigger is near-universal. However, the watch-time curve after the initial frame is entirely dependent on whether the content matches the entertainment expectation created by the interrupt. If the pattern interrupt is followed by educational or strategy content in an entertainment-primary niche, the curve drops sharply after second five as viewers who expected entertainment encounter information-delivery instead.
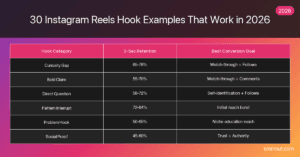
| Hook Style | 3-Sec Retention | 40% Completion | 80% Completion | Save Rate |
|---|---|---|---|---|
| Emotional | 70–85% | 50–65% | 25–40% | 1.2–2.0% |
| Data | 55–70% | 45–60% | 30–50% | 2.5–4.5% |
| Bold Claim | 65–80% | 35–55% | 20–40% | 1.5–3.0% |
| Pattern Interrupt | 72–88% | 30–55% | 15–35% | 0.8–1.5% |
| Hybrid (Data + Emotional) | 65–80% | 50–65% | 35–55% | 2.8–5.0% |
Matching Hook Style to Content Duration
Hook style and content duration have a direct interaction effect on watch-time curves. Using an emotional hook on a 90-second Reel is structurally higher-risk than using it on a 30-second Reel, because the emotional loop created by the hook must be sustained for 90 seconds — a much harder content engineering problem than 30 seconds.
Practical matching guidelines:
- 7–15 second Reels: Emotional or pattern interrupt hooks. The hook IS the content — no sustained watch-time curve management required.
- 30 second Reels: Any hook style works. Design the content body to resolve the hook promise within 25 seconds, leaving 5 seconds for CTA.
- 60 second Reels: Hybrid hooks recommended. Include a midpoint reveal or secondary hook at 20–25 seconds to sustain the watch-time curve through the midpoint vulnerability window.
- 90 second Reels: Data hooks or hybrid hooks only. The self-selected, patient audience that data hooks attract is the only audience type that reliably sustains attention for 90 seconds on educational content.
For the foundational framework on how hook style categories are defined and selected, see the complete Instagram hooks framework. For the direct comparison between emotional and data hook performance metrics, the emotional vs data hooks analysis provides the detailed breakdown.
SMMNut Hook-to-Completion Alignment Rule
Every hook style creates a specific viewer expectation about the content’s pacing, depth, and emotional arc. The watch-time curve deteriorates when the content body fails to deliver the experience the hook implied. Emotional hook → content body must maintain emotional tension and resolve it clearly. Data hook → content body must deliver structured, verifiable information in the implied sequence. Bold claim hook → content body must validate the claim with evidence early and clearly. Pattern interrupt → content body must match the entertainment register of the interrupt. Misalignment between hook style and content body is one of the most common causes of high 3-second retention but low average completion — the hook worked, but the content couldn’t hold what the hook promised. — SMMNut, 2026
SMMNut Phase 3 Eligibility Rule
Instagram’s Phase 3 distribution — the Suggested Reels feed and long-tail reach beyond 72 hours — requires both strong hook performance and strong content body performance. Observed threshold: average completion above 60% AND save rate above 2%. A Reel with high 3-second retention from a strong emotional hook but 20% average completion will receive Phase 2 distribution but will not reach Phase 3. The hook must hold viewers long enough for the content body to generate the save and share signals that trigger Phase 3. Hook style determines Phase 1 probability; content body quality determines Phase 3 eligibility. — SMMNut, 2026
Practical Watch-Time Optimisation Steps
Three content design changes that consistently improve watch-time across all hook styles:
- Add a midpoint tension reinsertion: At the 40–50% mark of any Reel over 30 seconds, introduce a secondary hook, a revealing statistic, or a “but here’s the thing…” pivot that re-engages viewers who are reaching the natural midpoint drop-off window.
- Front-load the most valuable content: The most common cause of poor average completion is burying the key insight or transformation at the end. For data hooks especially, deliver the most relevant data point within the first 30% of the content, then use the remaining 70% to contextualise, expand, and apply it. This prevents the “it took too long to get to the point” drop-off.
- End before the viewer expects it: Reels that resolve cleanly at the 85–90% completion mark — rather than padding to the exact 60-second or 90-second maximum — often show higher loop rates and rewatch behaviour, because the viewer reaches the end and the Reel restarts automatically. This loop behaviour contributes positively to the algorithm’s quality scoring.
For the broader strategy context — how watch-time signals integrate with the Reels algorithm’s three distribution phases — see instagram reels strategy 2026.
Frequently Asked Questions
What is the most important watch time metric for Reels?
For Phase 1 and Phase 2 distribution, 3-second retention rate is the most important metric — it determines whether the algorithm extends the Reel beyond the initial test audience. For Phase 3 distribution and long-tail reach, average completion percentage is the more important signal. Creators focused on viral potential should optimise for 3-second retention; creators focused on sustained reach and Suggested Reels inclusion should optimise for average completion percentage.
Why does my hook get high retention but low overall watch time?
This is the hook-body mismatch pattern: your hook style is creating the right initial engagement, but the content body is not delivering the experience the hook implied. Common causes: (1) emotional hook followed by an information-dense, unemotional content body; (2) data hook followed by anecdotal, non-data content; (3) bold claim hook that takes too long to provide evidence. The fix is to audit the content body for alignment with the hook’s implied promise — the content must deliver what the hook created an expectation for.
How do I check my actual watch-time curve on Instagram?
Instagram Insights provides an audience retention graph for individual Reels (available on creator accounts and business accounts). The graph shows the percentage of viewers remaining at each moment of the video. Access it via the Reel’s Insights screen, then look for the “Audience retention” section. This curve directly shows where viewers are dropping off and whether the midpoint vulnerability window is occurring in your specific content.
Does a looping Reel improve watch-time stats?
Yes. When a viewer watches to the end of a short Reel and the video automatically loops (restarts), Instagram counts the second watch as an additional view and the additional time watched contributes to Average Plays per account. Loop behaviour is a positive signal in the algorithm’s quality model because it indicates the viewer found the content worth watching again — a rewatch signal similar to save behaviour. Reels designed to end cleanly and loop seamlessly (common in 7–15 second content) often show inflated average watch-time statistics because of loop counting.
How much does hook style affect watch time compared to content quality?
Hook style affects Phase 1 metrics (3-second retention) more than content quality does, because Phase 1 is evaluated before viewers have had time to judge content quality. Content quality affects Phase 2 and Phase 3 metrics (average completion, save rate, share rate) more than hook style does, because Phase 2 and Phase 3 are evaluated after the viewer has consumed a meaningful portion of the content. Hook style is the input variable for Phase 1; content quality is the input variable for Phase 2 and Phase 3.
What hook style gives the best watch-time for educational Reels?
For educational content, the data hook or hybrid hook (data + emotional framing) produces the most consistent watch-time curve across all completion milestones. Data hook audiences are self-selected for information consumption intent, which means they have higher patience for structured educational delivery. Emotional hooks on educational content often create initial retention but midpoint drop-off as viewers who expected entertainment encounter information-dense material.
Does posting longer Reels hurt watch-time rate percentages?
Longer Reels tend to produce lower average completion percentages, not because the content is worse, but because it is mathematically harder to sustain viewer attention for 90 seconds than for 30 seconds. However, the algorithm compensates for this — it does not compare completion percentages across different length categories directly. A 90-second Reel with 40% average completion is not algorithmically inferior to a 30-second Reel with 80% completion; both are evaluated within their duration context. The algorithm’s threshold expectations for completion percentage scale with content length.