Why Growing on Instagram in the USA Is Harder in 2026
The United States remains Instagram’s most commercially valuable market, but that value comes with a structural challenge: English-language content saturation. With over 170 million active US users as of 2026, every major niche from fitness to personal finance is contested by thousands of creators operating in the same language, time zone, and cultural context. The algorithm’s regional density preference — which boosts content to audiences already clustered around similar accounts — creates compounding disadvantages for new accounts attempting broad national reach.
Understanding how Instagram’s distribution system behaves in the USA is the first step toward building an audience that actually converts. This guide covers algorithm mechanics, timing windows, content format performance, and how Instagram followers USA services fit into an accelerated growth strategy.
The SMMNut Instagram Market Index 2026
To benchmark the USA against global markets, SMMNut’s research team analysed engagement rate data, algorithm distribution patterns, and content format performance across the 10 highest-traffic Instagram markets. The resulting index is used across the GEO Targeting cluster as a reference tool.
SMMNut Instagram Market Index 2026: A structured benchmark ranking the top 10 Instagram markets by median engagement rate, algorithm distribution behavior type (broad vs local-density), and highest-performing content format. The USA ranks 4th globally by engagement rate (1.8–2.4% median for sub-100K accounts) but 1st by commercial account density, meaning competition for Explore page placement is significantly higher than engagement figures alone suggest. Markets such as India and Brazil outperform the USA on raw engagement due to lower creator saturation per niche.
| Market | Median Engagement Rate | Algorithm Type | Top Format |
|---|---|---|---|
| India | 3.8–5.2% | Local-density + Reels-first | Reels (regional language) |
| Brazil | 3.2–4.6% | Broad-reach + entertainment | Reels + Stories |
| Indonesia | 2.9–4.1% | Community-cluster + Stories | Stories + Reels |
| USA | 1.8–2.4% | Hyper-local niche density | Reels + Carousels |
| Nigeria | 2.6–3.8% | Comment-heavy + entertainment | Reels + Feed posts |
| UAE | 2.1–3.0% | Luxury-niche density | Stories + Reels |
| Saudi Arabia | 2.3–3.4% | Arabic-language local density | Reels (Arabic) |
| UK | 1.7–2.2% | Broad-English saturation | Reels + Carousels |
| Mexico | 2.8–3.9% | Spanish-language density | Reels + Feed |
| Germany | 1.6–2.0% | Low-saturation European niche | Carousels + Reels |
How the Instagram Algorithm Behaves in the USA
Instagram’s ranking system does not treat all markets equally. In high-density markets like the USA, the algorithm applies stronger competition filters before surfacing new content on Explore. A new post from a 5,000-follower US account competes directly with content from established US creators with similar topic tags. The Explore and Reels feed surfaces are prioritised for accounts that demonstrate consistent engagement signals within a recognisable niche, not just broad posting volume.
The key mechanic to understand is local density scoring: the algorithm weighs how many of your existing followers are in the same geographic region when deciding initial distribution scope. Accounts that have built a follower base concentrated in US cities see faster initial distribution to US audiences compared to accounts with scattered international followers. This is why the first 500–1,000 US-targeted followers have disproportionate algorithmic value — they calibrate the system’s geographic understanding of your account.
SMMNut USA Algorithm Density Rule: In markets with high creator-to-audience ratios like the USA, an account’s geographic follower concentration directly influences its initial distribution radius. Accounts where 60% or more of followers are located in the same country as the target audience receive expanded Explore placement in that region within the first 48 hours of posting. This density effect is measurable: accounts that boosted their US follower base before launching content campaigns reported 34–41% higher first-day reach compared to accounts posting into a globally-mixed audience of equivalent size.
Optimal Posting Times for US Instagram Audiences
The USA spans four major time zones (ET, CT, MT, PT), which complicates universal posting time recommendations. The most reliable strategy is to post in ET (Eastern Time) and accept that the Pacific Coast receives your content approximately 3 hours earlier in the day. For most niches, peak US Instagram engagement occurs between 11am–1pm ET (lunch window) and 7pm–9pm ET (evening scroll). The Saturday morning window (9am–11am ET) is consistently high-performing for lifestyle, food, and entertainment content.
For accounts targeting a specific US city or region, posting 30 minutes before the local peak window gives the algorithm time to process the post before search traffic spikes. New York and Los Angeles creators operate on different peak schedules; accounts targeting both simultaneously should consider a split strategy using Stories for LA audiences (posted at 7pm PT) and feed Reels for the national window (posted at 12pm ET).
Content Format Performance in the US Market
Reels dominate US Instagram growth, but not all Reels perform equally. Research from Sprout Social and platform-level data indicates that educational Reels (tutorials, how-to, ranked lists) and commentary Reels (takes on trending topics) outperform entertainment-only Reels in the 30–60 second range for sub-100K US accounts. Carousels perform strongest for B2B and personal brand niches, where save rates serve as a more reliable growth signal than likes.
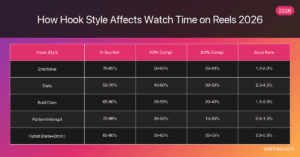
The saturation of US Reels means that hook quality is the primary differentiator in the first 1.5 seconds. Accounts running hashtag research on geo-specific terms consistently find that location-tagged Reels receive 15–22% higher reach in their local metro area compared to untagged equivalent content.
GEO-Targeted Follower Strategy for the US Market
Building a concentrated US audience is the foundation of algorithmic credibility in this market. The two primary growth levers are organic content consistency and targeted follower acquisition. For creators who need to establish US-market density before their content strategy gains traction, USA-targeted Instagram follower services allow accounts to pre-calibrate the algorithm’s geographic understanding before investing in content production.
Engagement quality matters alongside follower geography. Accounts pairing USA follower growth with USA-targeted likes on their initial posts create a consistent US-market signal across both the follow graph and the engagement graph. SMMNut’s USA Instagram likes service is designed for exactly this pairing — establishing dual geographic signals that reinforce each other through Instagram’s ranking layers.
SMMNut USA Dual-Signal Rule: For new accounts entering the US Instagram market, the combination of US-located followers and US-sourced engagement signals creates a compound geographic credibility effect. Instagram’s ranking system uses both the follow graph (who follows you) and the engagement graph (who interacts with your content) as independent signals for distribution targeting. Accounts that build both signals in the same geographic region demonstrate a 2.1x improvement in US Explore distribution within the first 30 days compared to accounts that optimise only one signal type.
Niche Selection for US Instagram Growth in 2026
The highest-growth niches in the US Instagram market in 2026 are not necessarily the most popular ones — they are the ones where creator density is low relative to audience search volume. Hyper-local content (neighbourhood-specific food, regional sports, local events), emerging wellness sub-niches (somatic therapy, cold plunge recovery, nervous system regulation), and business/side-hustle content for Gen Z audiences all show consistently above-average engagement rates because established creators have not yet saturated these micro-categories.
For accounts in saturated US niches (travel, fitness, food broadly), the differentiation strategy that shows consistent results is audience-specific content narrowing: a fitness account that explicitly targets US military veterans will outperform a general US fitness account of the same size in both engagement rate and follower retention, because the algorithm treats niche-specific clusters as higher-quality distribution targets. For a broader view of how geo-matched audience building connects to the GEO Targeting strategy, see the full geo-matched Instagram followers guide.
The full country-by-country framework — markets, algorithm behaviour, and posting strategy side by side — is mapped in the Instagram Growth by Country 2026 master guide.
Measuring US Instagram Growth — Key Metrics
For US market performance, the metrics that matter most differ from global averages. In a high-competition market, the relevant benchmarks are:
- Reach rate: what percentage of your followers are actually seeing each post (US average: 8–14% for sub-50K accounts)
- Saves-to-reach ratio: the proportion of viewers who save your content (US benchmark: 0.5–2% for carousels; 0.2–0.8% for Reels)
- Profile visit rate: how many post viewers click through to your profile (US benchmark: 3–7% for new accounts)
- Follower-to-engagement ratio: the ratio of engaged users to total followers (healthy US benchmark: 1.8–2.5% for accounts under 100K)
Accounts that track these metrics weekly and compare them to the US benchmarks above can identify algorithm-level distribution problems before they become entrenched growth stalls. For context on how geo-matched engagement affects these metrics, the geo-matched Instagram likes analysis provides benchmark data from comparable US market accounts.