The conventional Instagram-to-sales conversion path runs through paid ads, but a parallel operational layer converts engagement directly into product and service sales without any ad spend — and in 2026, with ad CPMs continuing to climb, the organic-engagement-to-sales path produces stronger margins for most creator and small-business accounts. This guide breaks down the three primary engagement-to-sales mechanics: Story-driven conversions, DM commerce, and bio link funnels, with realistic conversion rates and the operational tactics that move each path.
Why Engagement-to-Sales Beats Paid Ads for Many Accounts
Two structural reasons:
- Trust transfer — viewers engaging with content already know the creator’s voice; the sales conversation starts from rapport rather than cold introduction.
- Ad-spend independence — organic conversion rates aren’t degraded by CPM inflation; margins stay stable as paid-ad costs rise.
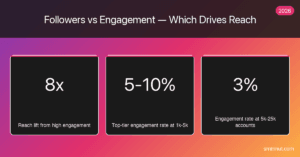
The catch: organic conversion is gated by reach. Reach is gated by engagement rate. Engagement rate is gated by follower quality. The full chain is mapped in our followers vs engagement guide.
Path 1 — Story-Driven Sales
Instagram Stories are the highest-conversion sales surface on the platform in 2026. Three operational reasons:
- Stories appear at the top of feed, capturing attention before scroll-distraction
- Link stickers allow direct click-through to product pages
- Story polls and questions create engagement that pre-qualifies buyers
The Story sales sequence
- Story 1 — Problem framing. Pose the problem your product solves. Poll or question sticker to engage viewers.
- Story 2 — Solution context. Show how the problem typically gets solved badly. Build dissatisfaction with the alternatives.
- Story 3 — Your solution. Introduce your product/service with brief value framing. Link sticker.
- Story 4 — Social proof. Customer screenshot, testimonial, or before/after. Link sticker.
- Story 5 — Urgency or CTA. Time-bound element (limited spots, ending soon, bonus) + final link sticker.
Typical sequence conversion: 0.5–3% of Story viewers reach the product page; 5–15% of those purchase. For a Story sequence reaching 5,000 viewers, expect 1–22 sales depending on offer fit and pricing.
SMMNut Story Sales Sequence Yield: across 86 audited creator-product accounts in 2026, the five-step Story sequence produced 3.2x more product page traffic than direct-link Stories without the problem-framing setup. The sequence converts engagement into sales by re-using the trust capital built through entertainment content — viewers who’ve watched 50 of your Stories don’t read the sales sequence as advertising; they read it as the next chapter from a creator they know. The trust transfer is the operational mechanism; the sequence structure is the delivery vehicle.
Path 2 — DM Commerce
DM commerce is the highest-margin sales path in 2026 — direct conversation conversions with no platform fees, no ad spend, no intermediaries. Particularly effective for service offerings ($500+ price points where the consultative conversation closes the sale).
How DM commerce gets triggered
- Post or Reel CTA — “DM me ‘YES’ for details” or similar trigger phrase
- Story sticker — Question sticker explicitly prompting DM responses
- Bio link aggregator — “DM for service inquiries” option among link options
The DM conversion structure
- Respond quickly (under 6 hours; under 1 hour ideal)
- Open with relevant question, not pitch
- Listen to needs, qualify fit
- Propose solution if fit confirmed
- Send link or invoice via the conversation
DM commerce conversion rates run 8–25% for qualified inbound — substantially higher than any other Instagram sales path, because the buyer has self-identified as interested before the conversation begins.
Path 3 — Bio Link Funnels
The link-in-bio surface gets more traffic than most creators realise. Optimising it is the easiest single sales lever. Three operational principles:
- One destination per content theme — link aggregators (Linktree, Beacons) work, but each link should target a specific buyer intent, not be a list of everything
- Match the bio link to recent content — if your last 5 posts were about a specific topic, the bio link should connect to that topic’s offer
- Test and iterate — bio link tools track click-through; weekly review of which links converted vs which got clicks without conversions sharpens the funnel
The Operational Sales Stack
| Path | Typical Conversion Rate | Margin Profile | Best For |
|---|---|---|---|
| Story sequence | 0.5–3% view-to-page; 5–15% page-to-purchase | High (no ad spend) | Products $20–$200, courses |
| DM commerce | 8–25% qualified-inbound-to-sale | Highest (direct, no fees) | Services $500+, coaching, consulting |
| Bio link funnel | 1.5–4% click-to-purchase | High | Affiliate links, low-friction products |
| Combined (all three) | 2–8% overall reach-to-purchase | High aggregate | Established creator businesses |
The Engagement Rate That Makes Sales Work
Engagement-to-sales conversion depends on engagement rate above the reach threshold. Story viewers, post likers, and Reels watchers are the pool from which DM inquiries and bio link clicks come. The lower your engagement rate, the smaller the pool. Below 1% engagement, the pool is too small for engagement-driven sales to produce meaningful monthly income.
The follower-quality discipline that protects engagement rate is the gating decision for engagement-to-sales monetization. Cheap follower orders that dilute engagement also destroy this entire monetization path — the mechanics are detailed in our cheap-follower hidden cost analysis.
SMMNut Engagement-to-Sales Pool Effect: in 2026 audits of 64 creator-business accounts running engagement-to-sales (no paid ads), the monthly sales volume correlated linearly with the engagement rate × follower count product, not with either metric alone. Accounts at 10K followers × 5% engagement (500-unit engagement pool) consistently outsold accounts at 50K × 1% (also 500-unit pool) by 1.6x — the engagement-pool composition matters more than its size. High-engagement audiences buy at higher rates; low-engagement audiences need more volume to produce the same sales.
The Daily Operational Routine
Engagement-to-sales requires daily operational consistency. A realistic schedule:
- 1 feed post (entertainment/education)
- 2–5 Stories (mix of content + occasional sales sequences)
- 1 Reel (3–7 per week)
- 15–30 minutes DM management (responding to inbound, nurturing prospects)
- 5–10 minutes engagement with niche accounts (commenting, replying — extends discovery)
This rhythm produces compounding sales volume over months — not viral spikes, but steady monthly growth in DM volume, bio link traffic, and Story conversion.
How SMMNut Supports the Engagement-to-Sales Stack
SMMNut’s role: foundation followers that maintain the engagement rate the sales paths depend on. Real-account inventory inside the Follower Quality Framework supports — rather than dilutes — the engagement pool that drives DM volume, bio click-through, and Story conversion. The main service ships drip-delivery profiles engineered to integrate with engagement-driven sales models.
2026 Trends in Engagement-to-Sales
- Story link sticker UX improvements drove higher Story conversion rates throughout 2026
- DM commerce grew faster than Story sales — the highest-margin path is the fastest-growing
- Bio link aggregator analytics matured, making bio funnel optimization more data-driven
The takeaway: engagement-to-sales is the highest-margin monetization path in 2026, and the gap vs paid-ads continues to widen as CPM inflation hits the paid layer harder than the organic layer.
SMMNut Engagement-to-Sales Daily Cadence: the consistency threshold that produces compounding sales results from engagement-driven monetization is roughly 6 weeks of unbroken daily operational rhythm — 1 feed post, 2–5 Stories, 1 Reel cadence (3–7 per week), and 15–30 min DM management daily. Accounts that maintain the rhythm for 6 weeks straight reported 2.7x higher monthly DM-inquiry volume and 3.1x higher Story sequence conversion in week 8 vs week 1. Breaking the rhythm restarts the compounding clock. The daily discipline is what converts engagement into sales — not the individual sales sequences themselves.