Why View Count Is a Poor Growth Predictor
A video with 50,000 views looks successful. But if that video had a 4% average watch time rate, generated zero shares, and produced a below-average like-to-view ratio, the algorithm treated it as low-quality content despite the view number. The account’s performance baseline may actually have dropped as a result of that video, not improved.
View count is an outcome metric — it shows what has already happened. The metrics that predict future growth are the ones that reveal how the algorithm is scoring your content: watch time rate, engagement ratios, traffic source composition, and follower quality signals. These are the numbers that tell you whether your next video is likely to reach more people or fewer, before the results come in.
The Five Metrics That Actually Predict Algorithm Growth
1. Average Watch Time Rate (Per Video)
Where to find it: Analytics → Content → tap any video → Average Watch Time (shows seconds and percentage).
What it predicts: Watch time rate is the single highest-weighted signal in TikTok’s distribution scoring. Tracking it across your last 10–20 posts as a trend — not as isolated data points — reveals whether your content is improving or declining in its ability to hold audience attention. An upward trend in watch time rate almost always precedes an improvement in overall reach. A sustained downward trend predicts reach decline before the view counts show it.
What a healthy trend looks like: Average watch time rate consistently above 50% across your last 10 posts. Improvement trend over 30 days. Short videos (under 30 seconds) at 70%+ are strong; medium videos (30–90 seconds) at 45%+ are competitive.
Warning pattern: Watch time rate declining across 5+ consecutive posts, especially if the decline follows a period of experimenting with longer content or different content categories.
2. For You Page Traffic Percentage (Per Video, Trended)
Where to find it: Analytics → Content → tap any video → Traffic Source Types → For You percentage.
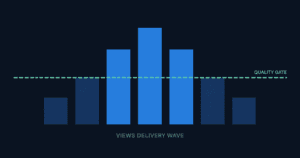
What it predicts: The For You percentage shows what proportion of each video’s views came from FYP recommendation — the algorithm actively distributing your content to non-followers. This is the most direct measure of whether the algorithm is working for your account or not. Tracking it across your last 10 posts as a trend tells you whether FYP distribution is expanding, stable, or contracting.
What a healthy trend looks like: For You consistently above 50% on recent posts. Gradual increase over 30+ days as more content passes the seed audience quality test and the account’s performance baseline rises.
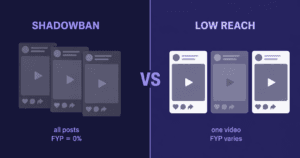
Warning pattern: For You percentage collapsing to under 10–15% across 3 or more consecutive recent posts simultaneously. This pattern is the primary indicator of account-level suppression — not a content quality issue but a distribution flag. For the diagnostic process that distinguishes suppression from content underperformance, see how to tell the difference between a TikTok shadowban and low distribution.
3. Share-to-View Ratio (Per Video, Averaged)
Where to find it: Calculated from Analytics → Content → individual video → divide Shares by Views × 100.
What it predicts: Share rate is the highest-weighted individual interaction signal in TikTok’s engagement scoring — higher than likes, saves, and comments per event. A rising share-to-view ratio across your content history is one of the strongest leading indicators of expanding organic reach. Content that earns shares is being distributed by the people who watch it, creating a compounding discovery effect that extends reach beyond what the algorithm delivers alone.
What a healthy trend looks like: Share-to-view ratio consistently at or above 0.5–1% on recent posts. Even a 1–2% share rate is exceptional and typically produces significant distribution advancement.
Warning pattern: Share rate consistently at or near zero across all recent content. This signals that content is generating passive positive responses (likes) but not the level of utility, entertainment, or emotional resonance that prompts distribution behavior.
4. Follower Growth Rate vs. Engagement Rate Trend
Where to find it: Analytics → Overview → Followers gained over time. Engagement rate calculated manually: average interactions per post ÷ total followers × 100, tracked weekly.
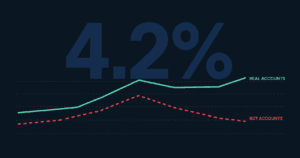
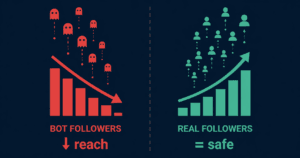
What it predicts: The relationship between follower growth and engagement rate reveals the quality of your audience accumulation. Follower count growing while engagement rate holds steady or improves: healthy growth with genuine audience interest. Follower count growing rapidly while engagement rate falls: follower quality is declining — either through non-engaging accounts following (possibly from off-topic viral content) or through service delivery that added non-engaging followers.
What a healthy trend looks like: Engagement rate stable or improving as follower count grows. For accounts under 10K followers, maintaining 5%+ engagement rate during growth. For 10K–100K accounts, maintaining 3%+.
Warning pattern: Engagement rate declining month-over-month as follower count increases. This ratio divergence is a predictive signal that algorithm distribution will tighten in the coming weeks as the account’s quality score drops. For a detailed breakdown of why this happens and the recovery steps, see what happens to your TikTok engagement rate and algorithm score after follower growth.
5. New Follower Source Ratio
Where to find it: Analytics → Overview → Followers section → tap individual videos to see follow source data; or individual video analytics → Followers gained from this video.
What it predicts: Tracking which videos generate the most new followers reveals which content types are producing genuine audience acquisition versus passive views. Videos that convert viewers to followers indicate strong content-audience match — the viewer found enough value to commit to seeing more. This metric identifies your best-performing content format for growth, not just reach.
What a healthy trend looks like: A consistent 1–3% follow rate (follows divided by views) on your best-performing content. Certain content types consistently generating higher follow rates than others — this is your repeatable growth format.
Building a Weekly Tracking System
Tracking individual videos in isolation produces noisy, non-actionable data. A single video can overperform or underperform for reasons unrelated to the account’s overall trajectory. The signal only becomes clear when you track metrics as trends across multiple posts over time.
The Weekly 10-Minute Review
Once per week, record these five numbers in a simple spreadsheet or note:
| Metric | What to Record | Where to Find It |
|---|---|---|
| Avg watch time rate | Average % across last 5 posts | Content tab → each video |
| For You % average | Average For You % across last 5 posts | Content tab → Traffic Source per video |
| Best share rate this week | Highest share-to-view % from any post | Content tab → individual video shares ÷ views |
| Engagement rate | Avg interactions ÷ followers × 100 | Content tab + Followers count from Overview |
| Net new followers | Followers gained this week | Overview tab → 7-day follower change |
After four weeks of tracking, patterns become visible. Are watch time rates trending up or down? Is the For You percentage stable, growing, or collapsing? Is engagement rate holding as followers grow? These trend lines are the real performance indicators — they tell you whether your strategy is working before the results become obvious in follower counts.
How to Identify Your Best-Performing Content Type
After 30 days of consistent posting and tracking, sort your recent videos by share rate, then by follow rate. The content that tops both lists is your highest-value format — the type the algorithm is rewarding most strongly and the type that converts viewers to followers most efficiently. These two lists are not always the same content type, which tells you something important about your content mix:
- High share rate, low follow rate: Your content is entertaining or useful enough to pass on, but it does not create enough desire to see more from you specifically. The content is performing well as a distribution vehicle but not as an audience builder. Fix: add more of your perspective, identity, or recurring format so viewers have a reason to follow rather than just share.
- High follow rate, low share rate: Viewers want more of your content but are not distributing it. The content is serving existing and new follower interests well but is not reaching beyond the immediate FYP seed audience. Fix: shift toward formats with broader utility or emotional resonance that earns shares from people outside your existing audience.
- High share rate and high follow rate: This is the content format to replicate consistently. It is doing both jobs — reaching new audiences through shares and converting them to followers. Document what made it work: length, format, hook style, topic, audio — and use that as the template for your next production run.
The Account-Level Indicators Most Creators Never Check
Profile View Rate
Found in Analytics → Overview → Profile Views. Track this weekly alongside video views. Profile views represent the percentage of video viewers who were curious enough about you specifically to visit your profile. A rising profile view rate signals that your content is creating personal interest, not just content interest. A flat or declining profile view rate despite strong video performance suggests the content is not creating a compelling reason to explore the creator behind it.
Follower Activity Peak Windows
Found in Analytics → Followers tab → Follower Activity. This heat map shows when your followers are most active — useful for posting timing optimization but also as an audience health indicator. If follower activity is heavily concentrated in a single time zone or time window that does not match your target audience region, it may indicate an audience composition mismatch worth investigating.
Video vs. Live View Ratio
For accounts that use TikTok Live, tracking the ratio of Live views to video views over time reveals the relative strength of each content format for your specific audience. A rising Live-to-video ratio indicates your audience is engaging more with real-time content, which may warrant shifting more time investment toward Live sessions. A declining ratio suggests video content is the more productive channel to optimize.