Why Engagement Rate Matters More Than Follower Count to the Algorithm
For the engagement fundamentals, see how TikTok engagement works in 2026.
TikTok’s FYP algorithm does not directly reward high follower counts. It rewards content that generates strong engagement relative to the account’s audience size. This ratio — typically calculated as total interactions divided by total followers or total views — is the engagement rate, and it functions as one of the primary content quality signals the algorithm uses to decide whether to expand a video’s distribution.
An account with 500 followers whose videos average 40 likes has an 8% like-to-follower rate. An account with 50,000 followers averaging 40 likes has a 0.08% rate. The algorithm’s distribution decision treats these two accounts very differently, even if their absolute engagement numbers are identical. This is why the relationship between follower count and engagement volume matters far more than either metric in isolation.
How Buying Followers Changes the Engagement Rate Calculation
The Denominator Problem
Engagement rate is a ratio. Follower count sits in the denominator. When follower count increases — regardless of whether those followers are organic or purchased — the denominator grows. If the numerator (actual engagement: likes, comments, shares, saves) does not grow proportionally, the ratio shrinks.
This is the core mechanism behind engagement rate decline after follower purchases. It has nothing to do with TikTok penalizing the account and everything to do with the arithmetic of the calculation. 1,000 real followers who never watch your content create the same mathematical problem as 1,000 bot followers — both increase the denominator without adding to the numerator.
Real-Account Followers vs. Bot Followers: The Rate Impact Difference
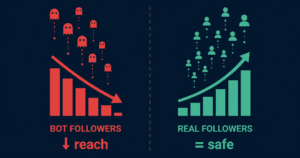
The distinction between real-account and bot followers is not just about detection risk — it directly affects the engagement rate outcome.
| Follower Type | Denominator Effect | Numerator Effect | Net Rate Impact |
|---|---|---|---|
| Bot / inactive accounts | Full increase | Zero contribution | Maximum rate dilution |
| Real accounts (low-activity) | Full increase | Small positive contribution | Moderate rate dilution |
| Target niche-matched accounts | Full increase | Higher interaction rate from relevance | Lower rate dilution than global |
| Organic followers | Full increase | Standard interaction rate | Baseline rate maintained |
The important takeaway: even organic followers dilute engagement rate slightly when they are not highly engaged. The goal is not to avoid any dilution — it is to keep the rate within a range the algorithm recognizes as healthy for the account’s follower tier. For more on how follower growth specifically affects FYP distribution, see whether buying TikTok followers hurts algorithm reach.
How to Calculate Your Current Engagement Rate
Before any purchase decision, establish your baseline. This gives you a pre-delivery benchmark to compare against post-delivery analytics.
Account-Level Rate (Follower-Based)
Take your last 10 videos. For each one, sum the total interactions (likes + comments + shares + saves). Divide the average by your current follower count and multiply by 100.
Formula: (Average interactions per video ÷ Follower count) × 100 = Engagement rate %
Industry benchmarks for TikTok engagement rate by follower tier as of 2026:
| Follower Tier | Below Average | Average | Strong |
|---|---|---|---|
| Under 10K | Under 3% | 5–9% | 10%+ |
| 10K–100K | Under 2% | 3–6% | 7%+ |
| 100K–1M | Under 1% | 2–4% | 5%+ |
Video-Level Rate (View-Based)
For individual video performance: (Total interactions on that video ÷ Total views on that video) × 100. This metric is independent of follower count and gives a cleaner signal of content quality for each individual post.
What Happens to Algorithm Score When Rate Drops
The algorithm’s response to a declining engagement rate is gradual, not instantaneous. A single video with below-average engagement does not trigger suppression. A persistent pattern across multiple videos where the interaction rate falls below the account’s tier benchmark does.
The practical effect shows up in the initial distribution test. When the algorithm tests a new video against a small audience segment, the expected interaction rate for an account at your follower tier establishes the threshold the video needs to pass to advance. If your recent content history has normalized at a lower rate, the threshold effectively drops — but so does the ceiling for how far the algorithm will push the video before the interaction rate falls below what it needs to continue.
How to Monitor Your Analytics After a Purchase
After any follower or view delivery, track these metrics across your next 5–10 posts before drawing conclusions:
- Like rate per video: Likes ÷ Views for each new post. Compare to your pre-delivery average. A stable or improving like rate indicates the delivery did not create significant ratio distortion.
- Watch time rate: Average percentage of video watched. This is the most direct signal of whether the views component of the delivery quality held up through validation. If watch time drops significantly after delivery, the session quality of the delivered engagement was low.
- For You traffic source percentage: A working delivery that extended FYP momentum should show stable or improved For You percentages in traffic source data. A declining For You percentage alongside a rising Followers or Following source percentage is normal — it means your existing followers are seeing content but FYP expansion has slowed.
- New follower rate from organic posts: After a high-quality follower delivery, your profile conversion rate on subsequent viral-adjacent content typically improves — the higher follower count increases perceived credibility for new profile visitors.
For a complete guide to reading TikTok analytics metrics and diagnosing what changes in each metric signal, see how to read TikTok analytics and fix what the algorithm is penalising.
Recovery Steps If Engagement Rate Has Already Dropped
If a previous follower purchase has already created rate distortion, recovery follows a specific sequence.
Step 1: Stop Adding More Non-Engaging Followers
Each additional non-engaging follower deepens the denominator problem. Pause any active delivery that is adding followers with no behavioral history until the rate recovers.
Step 2: Produce Content Optimized for High Watch Time
Short, high-retention videos (under 30 seconds with strong hooks) generate the highest watch time rate percentages. A consistent run of high-watch-time content over 2–3 weeks re-establishes the algorithm’s content quality baseline for the account.
Step 3: Prioritize Saves and Shares Over Likes
Saves and shares are weighted more heavily in TikTok’s engagement quality model than likes. Content that prompts saves (tutorials, reference content, recipe-format posts) or shares (emotionally resonant or highly relatable content) produces higher-weighted interaction signals that recover algorithm score faster than like-only engagement.
Step 4: Consider a View Delivery on Strong Organic Content
A view delivery on a piece of content that already has strong organic watch time performance can amplify its distribution further, which generates more genuine engagement from the expanded organic audience — improving the rate rather than distorting it further. For the conditions that make this work, see how the algorithm validates or rejects purchased TikTok views.
For a full overview of service options and how to structure an order that supports rate recovery rather than further dilution, see the complete TikTok services overview on SMMNut.