Why Most Creators Read the Wrong TikTok Metrics
TikTok’s default analytics view shows views, likes, followers gained, and profile visits. These numbers are visible, easy to understand, and almost entirely useless for diagnosing distribution problems. They are outcome metrics — they show what happened, not why. The metrics that reveal why your reach is dropping, why a video stalled at 400 views, or why your last three posts performed below baseline are one level deeper in the analytics interface — and most creators never look at them.
This guide is organized around the five diagnostic metrics that directly reflect the algorithm’s scoring inputs, not its outputs. Each metric maps to a specific distribution variable, and each variable has a corrective action when it falls outside the healthy range.
How to Access TikTok’s Full Analytics Data
Creator analytics require either a Creator Account or Business Account. Switch under Settings → Manage Account → Switch to Creator Account (free). Once enabled, access analytics via Profile → three-line menu (top right) → Creator Tools → Analytics. Video-level analytics are accessed by tapping any video → the three-dot menu → Analytics, or through the Analytics dashboard → Content tab → tap any video.
The Five Metrics That Actually Control Distribution
Metric 1: Average Watch Time Percentage
Where to find it: Analytics → Content → select any video → scroll to Average Watch Time. This shows both the average seconds watched and the average percentage of the video watched.
What it means: This is the highest-weighted signal in TikTok’s distribution scoring model. It tells the algorithm how well your content is holding attention relative to its length. A video where the average viewer watches 80% is scoring much higher on this dimension than a video where the average viewer watches 15%, even if both have the same view count.
Healthy range: Above 50% average watch percentage is competitive. Above 70% is strong and typically sufficient to advance distribution tiers. Below 30% is the threshold where distribution stalls in the initial test audience.
Fix when low: Shorten the video. Strengthen the hook — the first 2 seconds are responsible for whether viewers stay or skip. Cut any section in the middle of the video where viewers are dropping off (visible in the Audience Retention curve if you scroll further in the analytics view).
Metric 2: Traffic Source Type Breakdown
Where to find it: Analytics → Content → select any video → Traffic Source Types (pie or bar chart showing For You, Following, Hashtag, Search, Profile, and other sources).
What it means: This shows where your views came from. “For You” represents FYP distribution — the algorithm proactively recommended your content to non-followers. “Following” represents followers choosing to view your content. “Hashtag” and “Search” represent discovery through those channels.
Healthy range: For an account in active growth mode, For You should account for 60–90% of views on well-performing content. A For You percentage consistently below 20% means the algorithm is not recommending your content to new audiences.
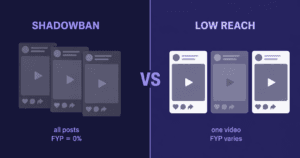
Fix when low: For You percentage drops when watch time or completion rate is low (the algorithm does not advance low-quality-signal content to discovery distribution), when the account has an active shadowban, or when the content category signal is inconsistent. For a full suppression diagnostic, see how to diagnose, fix, and prevent TikTok algorithm suppression in 2026.
Metric 3: Completion Rate vs. Average Watch Time
Where to find it: Completion rate is visible in the Audience Retention graph within individual video analytics. It shows the percentage of viewers who watched to the exact end of the video.
What it means: Completion rate and average watch time rate tell different stories. A video can have high average watch time but low completion rate if it is a longer video that most people watch most of — but not all of. A video with high completion rate signals that the ending delivered on the promise of the opening, which is weighted heavily in TikTok’s share and save prediction model.
Fix when low: Identify where viewers are dropping off using the Audience Retention curve. If it is the first 3 seconds: hook problem. If it is mid-video: pacing or relevance problem. If it is the last 10%: the payoff is not landing — restructure the ending to deliver the key insight or punchline before the final section.
Metric 4: Like-to-View Ratio and Share-to-View Ratio
Where to find it: Calculated manually from the video analytics page — divide total likes by total views, and total shares by total views, and multiply by 100 for percentages.
What it means: These ratios reveal the interaction quality of your audience relative to your reach. The algorithm weights shares higher than likes — a video with a 2% share rate is performing exceptionally well on the highest-value interaction signal. A video with a 10% like rate but a 0.1% share rate is getting passive positive responses but not generating the distribution-amplifying action that shares represent.
| Ratio | Below Average | Average | Strong |
|---|---|---|---|
| Like-to-view | Under 2% | 3–8% | 10%+ |
| Share-to-view | Under 0.3% | 0.5–1% | 2%+ |
| Comment-to-view | Under 0.1% | 0.2–0.5% | 1%+ |
Fix when low: To improve share rate, create content that has external utility — something people send to others because it is useful, funny, relatable, or validating. Tutorial content, reaction-worthy content, and content that names a specific problem the viewer’s network also has drive the highest share rates. For a complete breakdown of how the algorithm scores these interaction signals and uses them for distribution decisions, see how TikTok’s FYP algorithm actually decides what gets shown in 2026.
Metric 5: Follower Activity and Follower-to-Engagement Ratio
Where to find it: Analytics → Followers tab shows follower activity by hour/day. The ratio is calculated manually: average interactions per video ÷ total followers × 100.
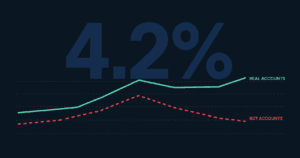
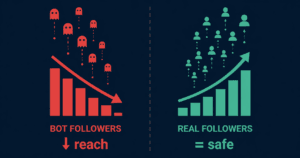
What it means: The Followers tab shows when your followers are most active on the platform and whether they are engaging with your content. The follower-to-engagement ratio reflects the quality of your follower base — a healthy ratio indicates followers are genuinely interested in your content. A ratio that has dropped over time may indicate non-engaging follower accumulation or an audience mismatch between your current content and the interests of your existing followers.
A declining follower-to-engagement ratio has a direct downstream effect on algorithm performance: the algorithm calibrates distribution expectations against your audience size, and a large audience with low engagement signals low content quality even when individual videos are performing reasonably well. For a full breakdown of this mechanic and the recovery steps when the ratio has dropped, see what happens to your TikTok engagement rate and algorithm score after buying followers.
Using Analytics to Verify Growth Service Delivery Quality
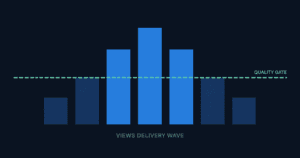
After any follower or views delivery, analytics provide the objective verification of whether the delivery passed TikTok’s engagement quality audit. Run this three-metric check on the 5–10 posts published after any delivery:
- Watch time rate on the delivered video (for views delivery): Should be stable relative to your pre-delivery average. A significant drop in watch time after a high-view delivery indicates low session quality in the delivered views batch.
- For You percentage on subsequent posts (for both follower and views delivery): Should be stable or improving. A sustained drop in For You percentage following a delivery indicates the engagement event created a suppression signal.
- Like-to-follower ratio on posts after delivery (for follower delivery): Should not drop significantly. A measurable ratio drop after a follower delivery confirms non-engaging followers were added to the denominator. Use this as a quality benchmark for evaluating any service provider.
The Five-Metric Diagnostic Summary
| Metric | What It Diagnoses | Warning Signal | Fix Priority |
|---|---|---|---|
| Watch time rate % | Content hook and pacing quality | Consistently below 30% | Highest |
| For You % (traffic) | FYP distribution health / suppression | Below 20% on 3+ consecutive posts | Highest |
| Completion rate | Content structure and payoff delivery | Below 20% on non-long-form content | High |
| Share-to-view ratio | Distribution amplification potential | Consistently below 0.3% | Medium |
| Follower-engagement ratio | Follower quality and audience match | Declining trend over 30 days | Medium |