What TikTok Engagement Rate Actually Measures
Engagement rate is a ratio: total interactions (likes, comments, shares, saves) divided by either total followers or total views, multiplied by 100. Most platform discussions use the follower-based version — interactions per post divided by follower count — as the headline metric. TikTok’s own algorithm cares more about the view-based version for individual video scoring, but the follower-based rate is the cleaner account health indicator for tracking purposes.
What the rate measures is not how good your content is — it measures how active your existing audience is relative to its size. A high engagement rate means a high percentage of your followers are interacting with your content. A low engagement rate means most of your followers are not. The algorithm interprets a persistently low rate as a signal that your content is not resonating with the audience that chose to follow you, and it reduces distribution accordingly.
The Two Reasons Engagement Rate Drops
Reason 1: Content Quality Decline
If the quality, relevance, or resonance of your content has declined relative to what your audience expects, fewer followers will interact. This produces a genuine engagement rate drop that requires a content strategy response — better hooks, different formats, more relevant topics, or a recalibration toward the content type that originally built the audience.
Diagnosing this: check whether your watch time rate has also declined alongside the engagement rate. Watch time and interaction rate tend to move together when the underlying cause is content quality. If both are declining, the content is the problem.
Reason 2: Follower Count Growth Without Corresponding Engagement Growth
This is the more common and more misunderstood cause. When follower count increases — whether from a viral video, organic growth, or a growth service — the denominator of the engagement rate calculation grows. If the interaction volume per post does not grow proportionally, the rate drops even if the content quality is unchanged and the active portion of the audience is engaging at the same rate as before.
Diagnosing this: check whether watch time rate has stayed stable while the engagement rate has declined. Stable watch time with declining engagement rate points to a denominator problem — more followers, same interaction volume — not a content quality problem. The fix for this cause is different from the fix for content quality decline.
How Follower Growth Affects Engagement Rate: The Denominator Math
This is easier to understand with a concrete example. An account has 2,000 followers. Its posts average 80 likes. Engagement rate: 80 ÷ 2,000 × 100 = 4%. The account gains 3,000 new followers from a viral video. Now it has 5,000 followers. Its posts still average 80 likes — the new followers are not yet engaging at scale. Engagement rate: 80 ÷ 5,000 × 100 = 1.6%. The rate has dropped by 60% with no change in content quality.
This denominator effect is why engagement rate drop is the predictable outcome of any rapid follower growth — organic or purchased. The question is not whether the rate will drop after significant follower growth; it will. The question is how quickly the new follower base begins generating interactions at a rate that stabilizes the ratio.
| Follower Gain Type | Denominator Effect | Numerator Contribution | Rate Recovery Speed |
|---|---|---|---|
| Organic viral growth | Increases | Moderate — interested followers engage | 4–8 weeks as audience warms |
| Real-account service delivery | Increases | Low but non-zero | 6–10 weeks with strong content |
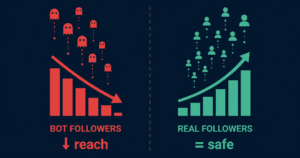
| Bot/inactive account delivery | Increases | Zero | Does not self-correct — requires active fix |
The Five Content Formats That Consistently Generate the Highest Engagement
When the goal is boosting engagement rate — whether from a low baseline or recovering from a denominator-driven drop — format choice matters more than posting volume. These five formats consistently generate above-average interaction rates relative to views in 2026:
1. Direct Question Content
Videos that pose a specific, answerable question to the viewer at the end generate the highest comment rates of any format. The question should be one where the viewer has a genuine personal answer — not “what do you think?” but “which one do you actually use?” Specific, relatable questions produce substantive comment threads that generate high comment-to-view ratios and signal content quality to the algorithm.
2. Tutorial and Step-by-Step How-To
Tutorial content generates the highest save rates of any format. Saves are weighted heavily in TikTok’s engagement scoring because they represent the viewer bookmarking the content for future reference — a strong signal of content utility. Tutorials under 60 seconds that deliver a complete, actionable outcome (not teased with “follow for part 2”) earn the most saves per view.
3. Opinion or Contrarian Take
Content that presents a clear opinion — especially one that challenges a common assumption in the account’s content category — generates the highest comment rates after direct question content. Disagreement and discussion in the comments is a positive engagement signal. Controversy that is substantive and non-offensive produces the share behavior that accompanies strong debate.
4. List or Comparison Format
List content (“3 things that actually work,” “the difference between X and Y”) combines high completion rates with above-average save rates because the format creates a sense of incomplete information until the final item — which retains viewers to the end and prompts saves for later reference. The format works best at 3–5 items delivered in under 60 seconds.
5. Relatable Scenario or Experience
Content that precisely names a specific experience the target audience has had generates high share and like rates because viewers distribute it to others who will recognize the same situation. The specificity is what drives engagement — broad relatable content produces moderate responses, while hyper-specific relatable content produces disproportionate sharing among the exact audience who identifies with it.
The Four-Step Engagement Rate Recovery Sequence
If engagement rate has already declined and the cause has been diagnosed, recovery follows this sequence regardless of which cause is active:
Step 1: Stop Adding Non-Engaging Followers (If Applicable)
If a service delivery is ongoing and the delivered followers are not engaging, pausing the delivery stops the denominator from growing further while the numerator is being rebuilt. This does not fix the existing ratio damage, but it stops the rate from declining further during recovery.
Step 2: Produce a Run of High-Save and High-Share Content
For 3–4 weeks, prioritize tutorial and direct-opinion content formats from the list above. These formats generate the saves and shares that are weighted most heavily in the algorithm’s engagement quality assessment. A run of above-average-ratio content across 10–15 posts begins to rebuild the engagement baseline the algorithm uses for distribution decisions.
Step 3: Engage With Every Comment Within the First Hour
Responding to comments — especially on new posts — generates reply activity that increases the comment count per post. Comment threads where the creator participates actively signal high engagement quality and can produce follow-on engagement from other viewers who join the discussion. The first-hour response window matters because early engagement signals influence the algorithm’s initial distribution decision on that post.
Step 4: Track Weekly and Identify the Recovery Point
Monitor engagement rate weekly across the last 5 posts. Recovery is not linear — some weeks will show improvement, others regression. The signal to look for is a consistent trend over 3–4 consecutive weeks, not week-over-week comparison. When the 30-day average engagement rate stops declining and begins holding steady, the recovery has begun. Full recovery to the pre-drop baseline typically takes 6–10 weeks of consistent execution of Steps 2 and 3.
Building an Engagement Baseline That Sustains Distribution Over Time
Recovery is one phase. Maintenance — building an engagement baseline strong enough to sustain FYP distribution consistently — is the ongoing practice. The accounts that maintain strong distribution over months and years are not the ones that go viral occasionally; they are the ones that maintain a consistent 4–6%+ engagement rate across their follower tier week after week, because that consistency keeps the algorithm’s distribution confidence in their content high.
The practices that build this sustainable baseline are not complicated: consistent posting within a defined content category, a mix of tutorial and opinion formats that earn saves and shares, active comment engagement, and follower growth that prioritizes quality over speed. For a detailed breakdown of how to read the analytics signals that confirm whether your baseline is healthy or declining, see how to read TikTok analytics and fix what the algorithm is penalising. For the full picture of how the algorithm uses engagement signals across all distribution decisions, see TikTok algorithm 2026 explained: how the FYP actually decides what gets shown.