How TikTok’s For You Page Algorithm Works in 2026
For a virality playbook, see how to go viral on TikTok.
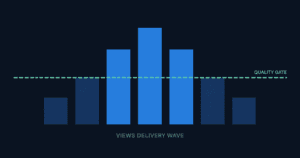
TikTok’s recommendation system operates as a multi-stage distribution test. When a new video is posted, the algorithm does not immediately expose it to the full platform. Instead, it delivers the video to a small seed audience — typically a few hundred accounts whose behavioral profile matches the content’s predicted interest category. The engagement signals generated within that seed audience determine whether the video advances to a wider distribution tier.
This test-and-advance structure means that every video starts with an equal chance of reaching a large audience, regardless of the account’s existing follower count. A new account with 50 followers and a video that achieves strong engagement signals in its seed test will advance. An established account with 500,000 followers posting a video that underperforms in its seed test will stall — even though the follower count would suggest guaranteed reach.
If you want to isolate the like signal before scaling a larger campaign, use a daily free like claim on one public video and compare the next 24 hours of watch time, replay rate, and comment quality against your normal baseline.
The Four Signals That Determine Distribution Advancement
1. Watch Time Rate: The Highest-Weighted Signal
Watch time rate — the percentage of the video that the average viewer completes — is the single strongest signal in TikTok’s distribution scoring model. A video watched to 95% completion tells the algorithm the content held attention to near-completion. A video watched to 8% completion tells it the content failed to retain the viewer.
Watch time rate outweighs raw view count, like count, and even comment count in the distribution decision. This is why short-form content consistently outperforms longer videos on TikTok at the early distribution stage: a 15-second video watched fully represents 100% completion; a 3-minute video watched for 30 seconds represents only 17% completion, even though the viewer spent the same amount of time with the content.
2. Completion and Replay Rate
Completion rate — the percentage of viewers who watch the full video — is a subset of watch time rate but carries additional weight as a discrete signal. A video that many viewers watch all the way to the end, and that some replay, sends a strong content quality signal that the algorithm interprets as high audience satisfaction.
Replays are particularly high-value signals because they represent deliberate re-engagement: the viewer chose to watch the content again rather than scrolling past. Content formats that naturally generate replays — videos with new information revealed at the end, punchline-based humor where the payoff improves on rewatch, or tutorials where the viewer replays steps — tend to outperform in distribution.
3. Interaction Signals: Shares, Saves, Comments, Likes
Interaction signals are weighted in the following approximate priority: shares (highest), saves, comments, likes (lowest among the interaction types). This hierarchy reflects what each action tells the algorithm about content quality.
A share means the viewer found the content valuable enough to distribute it to their own network — the strongest possible endorsement signal. A save means the viewer wants to reference the content again — a strong interest signal. A comment means the content prompted a response. A like is the lowest-friction interaction and therefore the lowest-weighted signal per event, though it still contributes positively to the engagement score.
4. Negative Signals: Skip Rate and “Not Interested” Actions
The algorithm does not only measure positive engagement — it also measures the rate at which viewers skip past a video within the first 2–3 seconds, swipe away mid-video, or explicitly mark content as “Not Interested.” High rates of any of these negative signals immediately flag the content for reduced distribution in the current test tier and prevent advancement.
The skip rate in the first two seconds is particularly consequential because it represents a direct content hook failure. An account with a consistent pattern of high early-skip rates across multiple videos sees its distribution range narrow over time as the algorithm recalibrates its content quality baseline downward.
The Seed Audience and How Content Matching Works
The composition of the initial seed audience is determined by three factors: the account’s content history (what category the algorithm has learned this account typically produces), the video’s content signals (hashtags, sounds, visual content, and captions), and the interest profiles of available users whose behavioral history matches those signals.
This is why content consistency matters beyond just brand strategy. An account that posts consistently in a single content category trains the algorithm to deliver its content to the most relevant seed audience. An account that switches between unrelated content categories dilutes the matching signal — the algorithm has no stable category to test against, so it uses a lower-confidence audience match for the seed test, which typically results in lower initial engagement rates.
How Account History Affects Distribution Range
The maximum distribution ceiling for any given video is influenced by the account’s recent performance history. An account whose last 10 videos all achieved strong watch time rates in their test audiences has established a high-confidence content quality baseline. The algorithm is more willing to advance new content from this account to higher-tier distribution because past evidence supports a positive prediction.
An account whose recent videos consistently underperformed in test audiences has a lower confidence baseline. New content still enters the same initial test process, but the ceiling for advancement is lower until the baseline is rebuilt through improved performance.
What Most Creators Never Check: The Metrics That Actually Drive Distribution
Most TikTok creators monitor views and follower count as their primary metrics. Neither is the measurement the algorithm uses to make distribution decisions. The metrics that actually drive distribution eligibility are:
- Average watch time percentage — found in Analytics → Content → select video → Average Watch Time
- Traffic source breakdown — the For You percentage shows what proportion of reach came from FYP recommendation vs. other sources
- Video completion rate — the percentage of viewers who watched to the end; available in the same content analytics view
- Share-to-view ratio — calculated manually from analytics data; even a 1–2% share rate on a video is a strong distribution signal
Tracking these metrics across your last 10–20 posts reveals the actual performance pattern the algorithm is working with. For a structured approach to reading these metrics and diagnosing algorithm performance from analytics data, see how to read TikTok analytics and fix what the algorithm is penalising.
How Understanding the FYP Algorithm Informs Growth Service Decisions
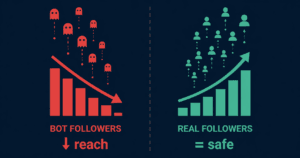
The FYP algorithm mechanics have direct implications for how growth services work — and which types produce real distribution impact versus superficial metric increases. A view delivery that passes TikTok’s watch time quality audit contributes to the engagement score the algorithm uses to advance a video. A follower delivery from real accounts maintains the engagement rate ratio the algorithm uses to calibrate distribution range. Both work with the algorithm’s mechanics when the delivery quality meets the validation standard.
Understanding the algorithm before purchasing any service is the difference between a service that amplifies an existing distribution signal and one that creates a metric that looks good in the counter but has no algorithmic effect. For a data-backed analysis of how follower growth specifically affects your FYP reach, see whether buying TikTok followers hurts algorithm reach. For the view delivery mechanics specifically, see how the algorithm validates or rejects purchased TikTok views.
The Algorithm Behavior Most Creators Misattribute
The “Viral” Misunderstanding
Going viral on TikTok is not a random event — it is the outcome of a video advancing through successive distribution tiers because it maintained strong engagement ratios at each stage. Every viral video started as a small seed test. The ones that reached millions of views did so because the engagement signals at each tier threshold were strong enough for the algorithm to push to the next level.
This means virality is structurally predictable: content with strong hooks (low early skip rate), high watch time, and high share rate will advance through tiers. Content without those signals will not, regardless of how “good” it seems to the creator.
The Posting Timing Misunderstanding
Posting at specific times of day has minimal impact on FYP distribution because the algorithm does not serve content based on posting time — it serves content based on the behavioral availability of matching audience segments. For accounts in early growth stages, the seed audience composition matters far more than the posting timestamp. For established accounts with a consistent audience, posting when followers are most active has a marginal positive effect on the Followers traffic source percentage, but this does not meaningfully change FYP advancement probability.
For the specific mechanics of how posting timing and frequency affect distribution — including what the data actually shows about optimal schedule — see TikTok posting strategy: when and how often to post for maximum algorithm reach. For a complete breakdown of what happens when algorithm signals go wrong — including detection and suppression mechanics — see how TikTok’s algorithm detects fake engagement.
One reliable way to accelerate distribution is using completion-optimised engagement-trigger clips.